
A US history enthusiast, I was really interested in the Homestead Nebraska project. For this project, scholars from the University of Nebraska used government data to connect members of different communities. Due to how homesteading worked in the US, these people had to prove to the government that they were effectively using the land, often with their neighbors serving as witnesses. As part of the project, the scholars made a network to show who was serving as a witness for who.
In this network, each of the nodes is a 19th or early 20th century Nebraska homesteader. The edges represent witnessing. Although they don’t visually represent who was serving as a witness vs who they were witnessing for, once you click on a node, a side tab opens which gives a more specific list of “outgoing” and “incoming” connections. I think this is unfortunate, and it would be nice if the edges were color-coded or if they had arrows to indicate the difference between different types of connections, but the network on its own already has a lot going on.
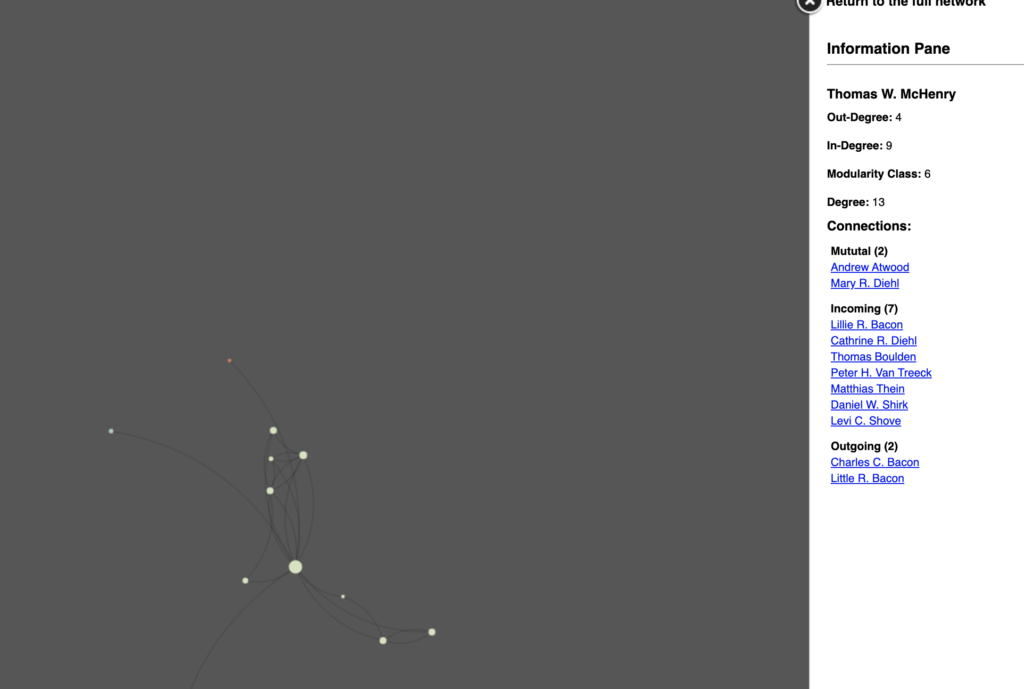
The website is fairly interactive, allowing the audience to zoom in or click on individual nodes for more specific interactions. They also have separate networks that are organized slightly differently. In the “leadership” network, each node is color-coded to show the in-degree, so that people with a lot of connections are marked in blue, while those with very little interactions are marked in red. This allows the audience to very easily visualize how some people probably served as leaders, or were at least more involved in the community than others, serving as a witness to many different people. The “community” and “geography” networks’ nodes are color-coded to show different communities, either based on interactions or local proximity. The node size in these networks is determined by in-degrees.
Overall, I think this is a really cool project that allows me to quickly visualize the connections people made in rural areas in the 19th and early 20th century. I am able to compare how their interactions worked to how people make social connections in modern times. I also think this network contradicts a popular image of homesteaders as being “isolated.” Just looking at the number of connections within these networks will prove that assumption wrong!
