Midterm Project – Birthplace of Tate Artists
My midterm project is a map showing the birthplace of Tate artists from 1950 to
My midterm project is a map showing the birthplace of Tate artists from 1950 to
Data visualization plays a crucial role in DH projects by enabling people to uncover patterns,
This week, I did a network analysis for Six Degrees of Francis Bacon, which aims
This lab is to create a custom campus map using ArcGIS to show my frequent
You can find my georeferenced map of Carleton Grounds here. Through georeferencing technology, we can
This week, our lab is 3D modeling archives. Our group chose to model Isaac M.
This week, I used DeOldify to colorize the black and white photo from Carleton’s archive.
We live in a highly digitized era where there is debate about whether students in
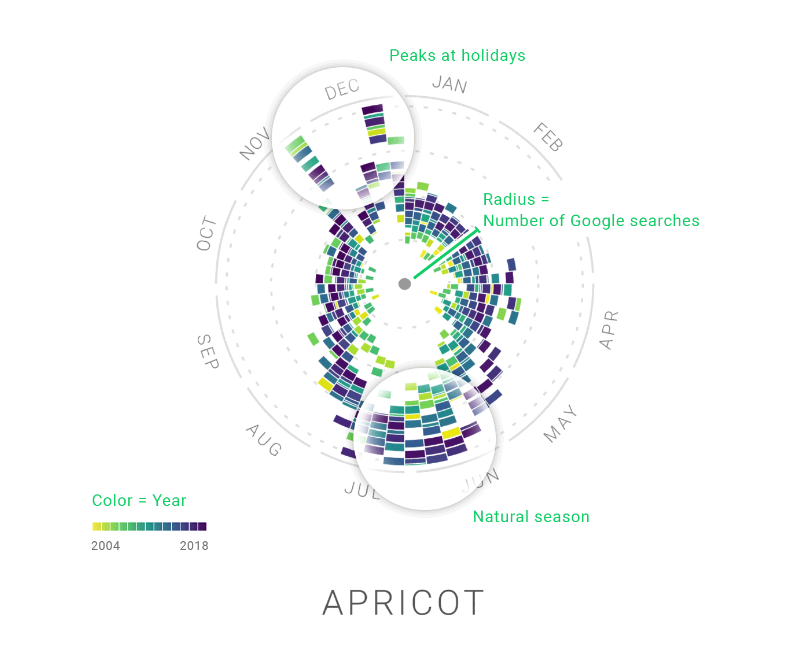
Rhythm of Food is a data visualization project that uses interactive graphs to show the
There is still a need to challenge the ‘add and stir’ model of diversity, a