https://ricedh.github.io/01-palladio.html
What (or who) are the nodes and what are the edges?
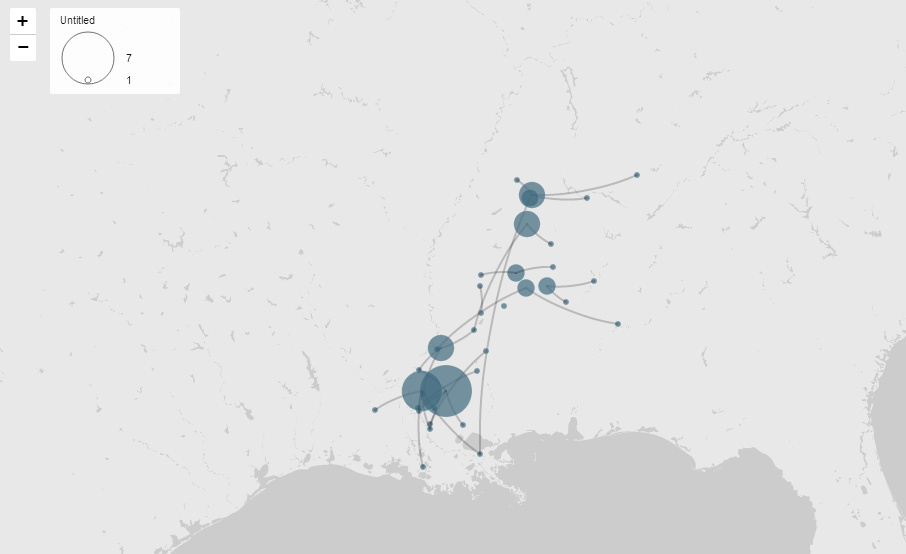
The nodes in this project are county jails and reported owner locations. The edges represent the paths taken by the runaway slaves.
How are the relationships characterized and categorized?
Relationships are characterized by the connections between nodes, representing the paths traveled by runaway slaves from their reported owner locations to the county jails where they were captured.
What interactions does the project allow? How does this impact their effectiveness and/or your engagement?
The project doesn’t allow for much interaction. It’s only a picture that we are allowed to see of the runaway slaves’ path. This takes away from engagement as there is no interactive element that makes me want to explore this topic further. It’s rather lackluster and I feel could be improved by allowing more interactive elements, maybe even a couple of popups when you hover over a node showing the original wanted poster.
How was the project created?
This project was created using Palladio as the primary tool for visualization and analysis. To create the data entries they manually entered geographic data into a spreadsheet and merged it with geographic coordinates for visualization. The project combines network analysis (identifying nodes and edges representing locations and paths) with spatial analysis (visualizing geographic patterns). In my opinion, in accordance with the reading, I feel like this project didn’t need to use network analysis. I feel like there’s a better way to show this information other than using a network analysis.
