Lab Assignment Week 6
For this lab, I chose to use Rawgraphs.io in order to visualize the data for
For this lab, I chose to use Rawgraphs.io in order to visualize the data for
What the data are (based on what sources, cleaned/filtered how) Our project is about exploring
The data for our timeline is the Carleton professor’s name, the year they started at
Above are at least two of the types of visualizations that we will use for
Ethan, Jenna, Kenton, and Margo One of our final project data visualizations is a bar
For my midterm project, I focused on the data from the Cushman Photograph Collection, particularly
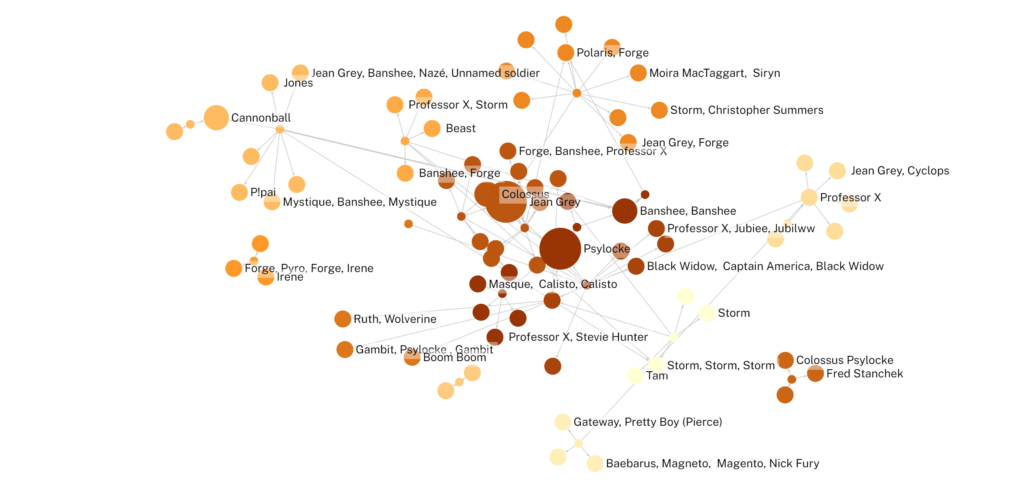
Link This is a project that visualizes the romantic interactions between characters in X-MEN issues
Click on the photo below to view my project: Here is the link in case
For my project I created a graph that shows the relationship I found between cover