Janet
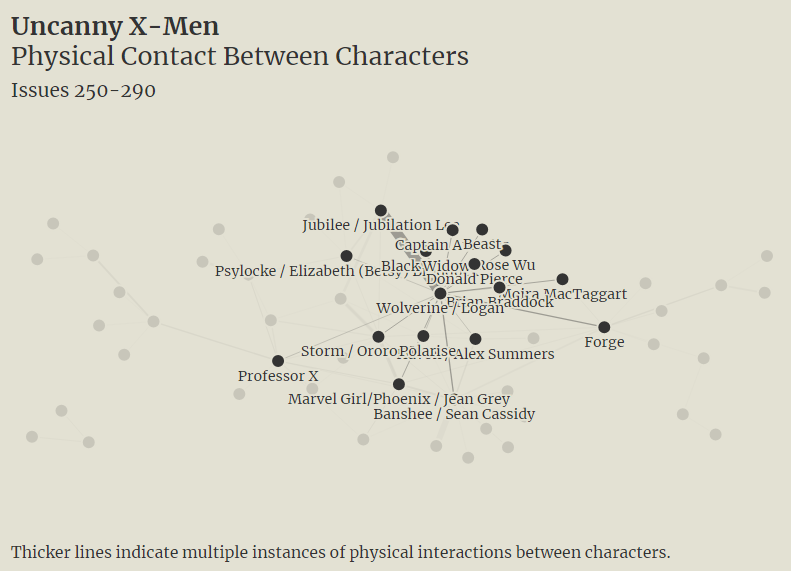
Midterm // Janet Duong
https://midterm.janetduong.sites.carleton.edu/ By laying the Uncanny X-Men Character dataset as a network analysis, I visualized some

Week 7 // Artists interpreting the world
Our project is about exploring the differences and similarities between traditional art and physical space

Week 6 // Different ways to show trends
I used Rawgraphs to create stream graph2 showing each name’s popularity over time, seperated by

Week 6 // Visual Data is Pretty Abstractive
Literally, as the Museum of Modern Art creates an exibit of artists “Innovating Abstract” art.
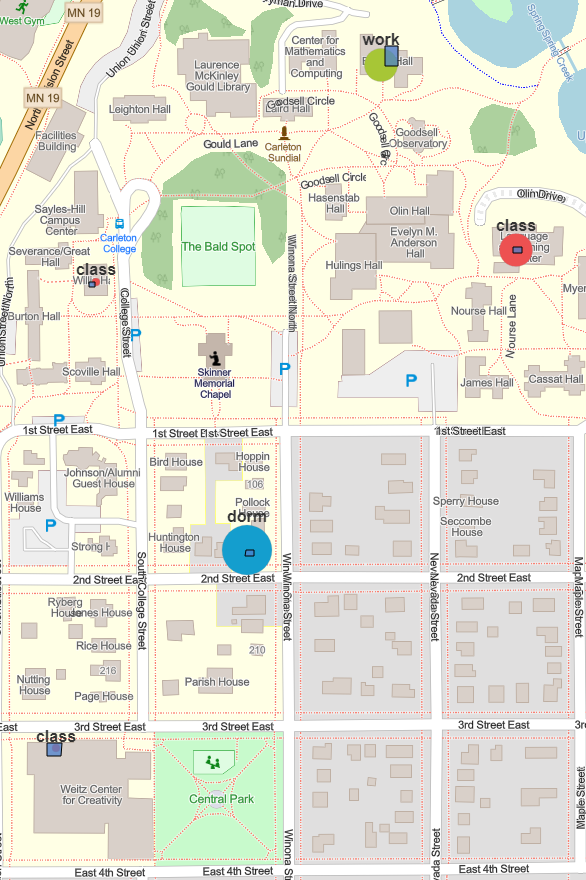
Week 5 // Stalker-net, but as a fun assignment!
The title is purely satirical I assure you. This is the lab for the mapping
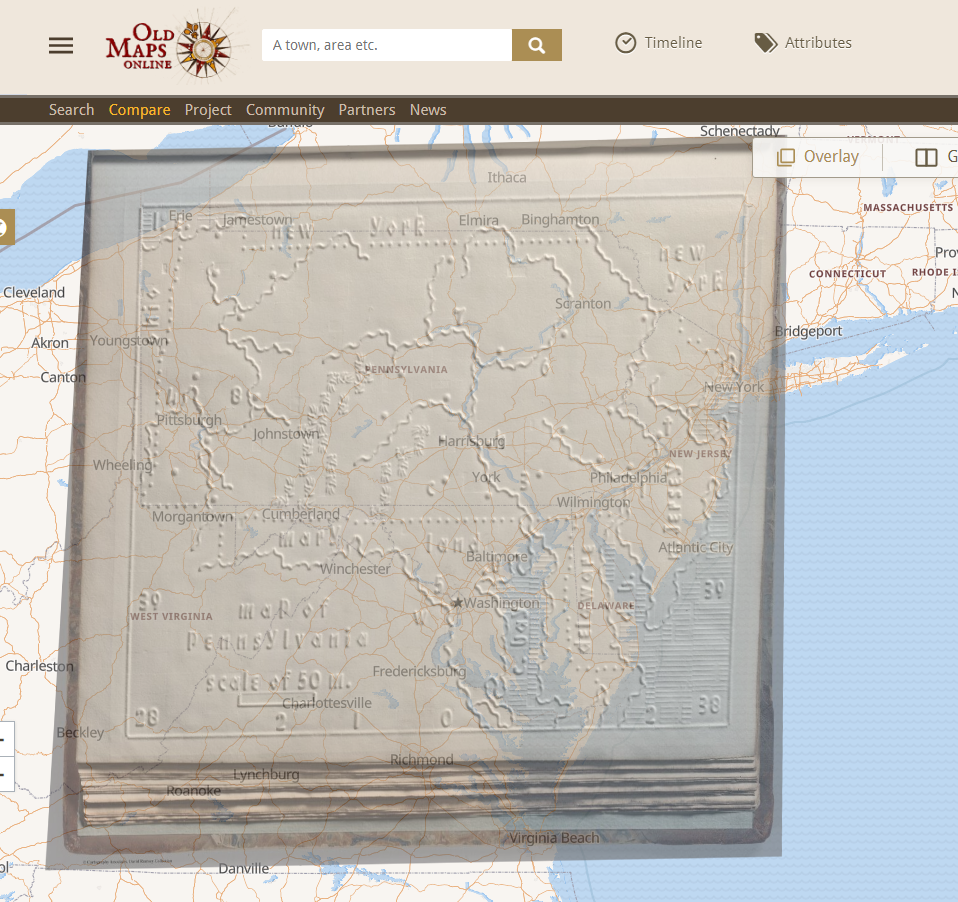
Week 5 // Infographic maps make me happy
https://davidrumsey.oldmapsonline.org/maps/74fe3c11-1792-5926-8016-c1290f59df4b/ I luckily had a pretty easy map to georecify, being one of an embossed

Week 4 // In Colorization, People Should be Coloring People
Out of the DeOldify process, I came up with more than one question about the
Week 3 // Why struggle when you can find feedback instead?
Learn to program whenever it is convenient, but start thinking about the computer sciences as