
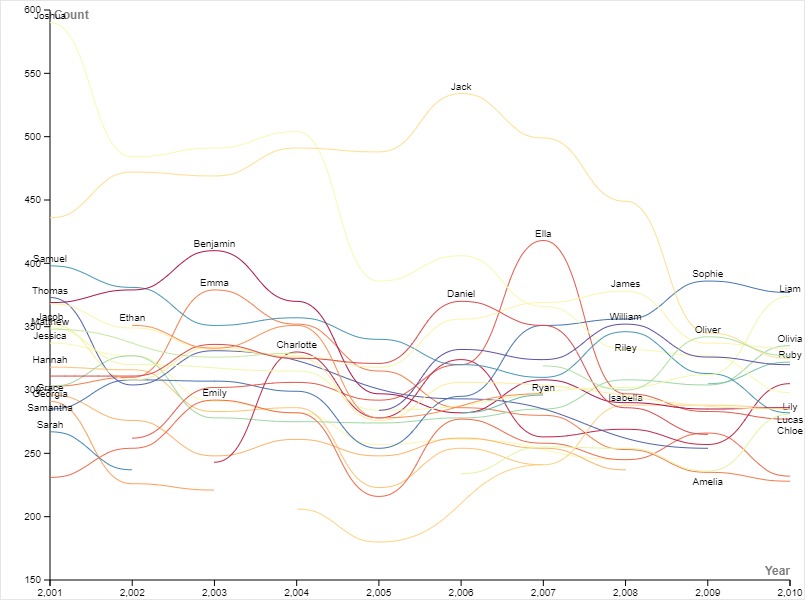
In my exploration of data, I chose to delve into the popularity of boy and girl names from 2001 to 2010. To visualize this data effectively, I chose a line graph. Line graphs are renowned for their ability to illustrate changes over time, making them an ideal choice for showcasing trends in name popularity.
One of the initial challenges I encountered was the default color scheme of the graph. All the lines were the same color, making it difficult to differentiate between them and understand which line represented which name. To improve clarity, I decided to change the colors. This adjustment enhanced the readability of the graph, making it easier for viewers to identify and interpret each line.
During the lecture by Lin, what stuck out to me was how data visualization is used to tell a story. Inspired by this concept, I approached my graph as a narrative of how name popularity evolved over the decade. This approach is aligned with the Digital Humanities, where data visualization serves as a means to attach a story to numerical data. By carefully selecting the appropriate graph and crafting a compelling narrative, we can effectively convey our message to the audience.
In conclustion, this reflects the importance of storytelling in Digital Humanities and underscores the significance of selecting the right visualization tools to communicate complex ideas. By infusing our data with narrative, we transform it into a compelling story that resonates with our audience.

I also used a line graph to try to tell a story about this dataset. Your reasoning for changing the color scheme was the same as mine except I colored the lines by gender. Your graph, as compared to mine, tells a story about individual names and trends over time as opposed to trends about names and gender. I think it’s super cool how the same graph can be used to tell different stories.